Land Oracle AI User Guide
Understand land faster, with less friction and fewer blind spots.
Subscription & Billing
Use the secure portal to update payment methods, download invoices, or cancel your subscription.
1. What Land Oracle AI Is (and Is Not)
What Land Oracle AI Is
A land intelligence and early-stage due diligence platform. It consolidates fragmented data—tax records, zoning, environmental constraints, and access indicators—into a single, visual decision surface.
The goal is not more data. The goal is faster, clearer understanding.
What Land Oracle AI Is Not
- It does NOT provide investment advice.
- It does NOT provide legal or zoning approvals.
- It does NOT predict financial returns.
- It does NOT tell you what to buy or sell.
All decisions remain with the user.
AI Transparency
AI is used to translate complex rules, summarize overlapping constraints, and surface patterns. It is NOT used to recommend decisions or predict outcomes.
2. How to Think About Land
Land Is a Constraint Problem
Most land issues are discovered late. Land Oracle AI helps surface constraints early (e.g., environmental overlays, zoning incompatibilities, access limitations).
Think Spatially, Not Sequentially
Land decisions happen on a map. Tables and exports are secondary. The map is your primary thinking surface.
Guide Attention, Not Certainty
Visual signals help you decide where to look closer and what differs from nearby parcels. They are indicators, not final conclusions.
3. The Core Workflow
Land Oracle AI follows a repeatable loop that mirrors how experienced land professionals think.
4. Understanding the Dashboard
The dashboard is your command center, bringing all analysis into one place.
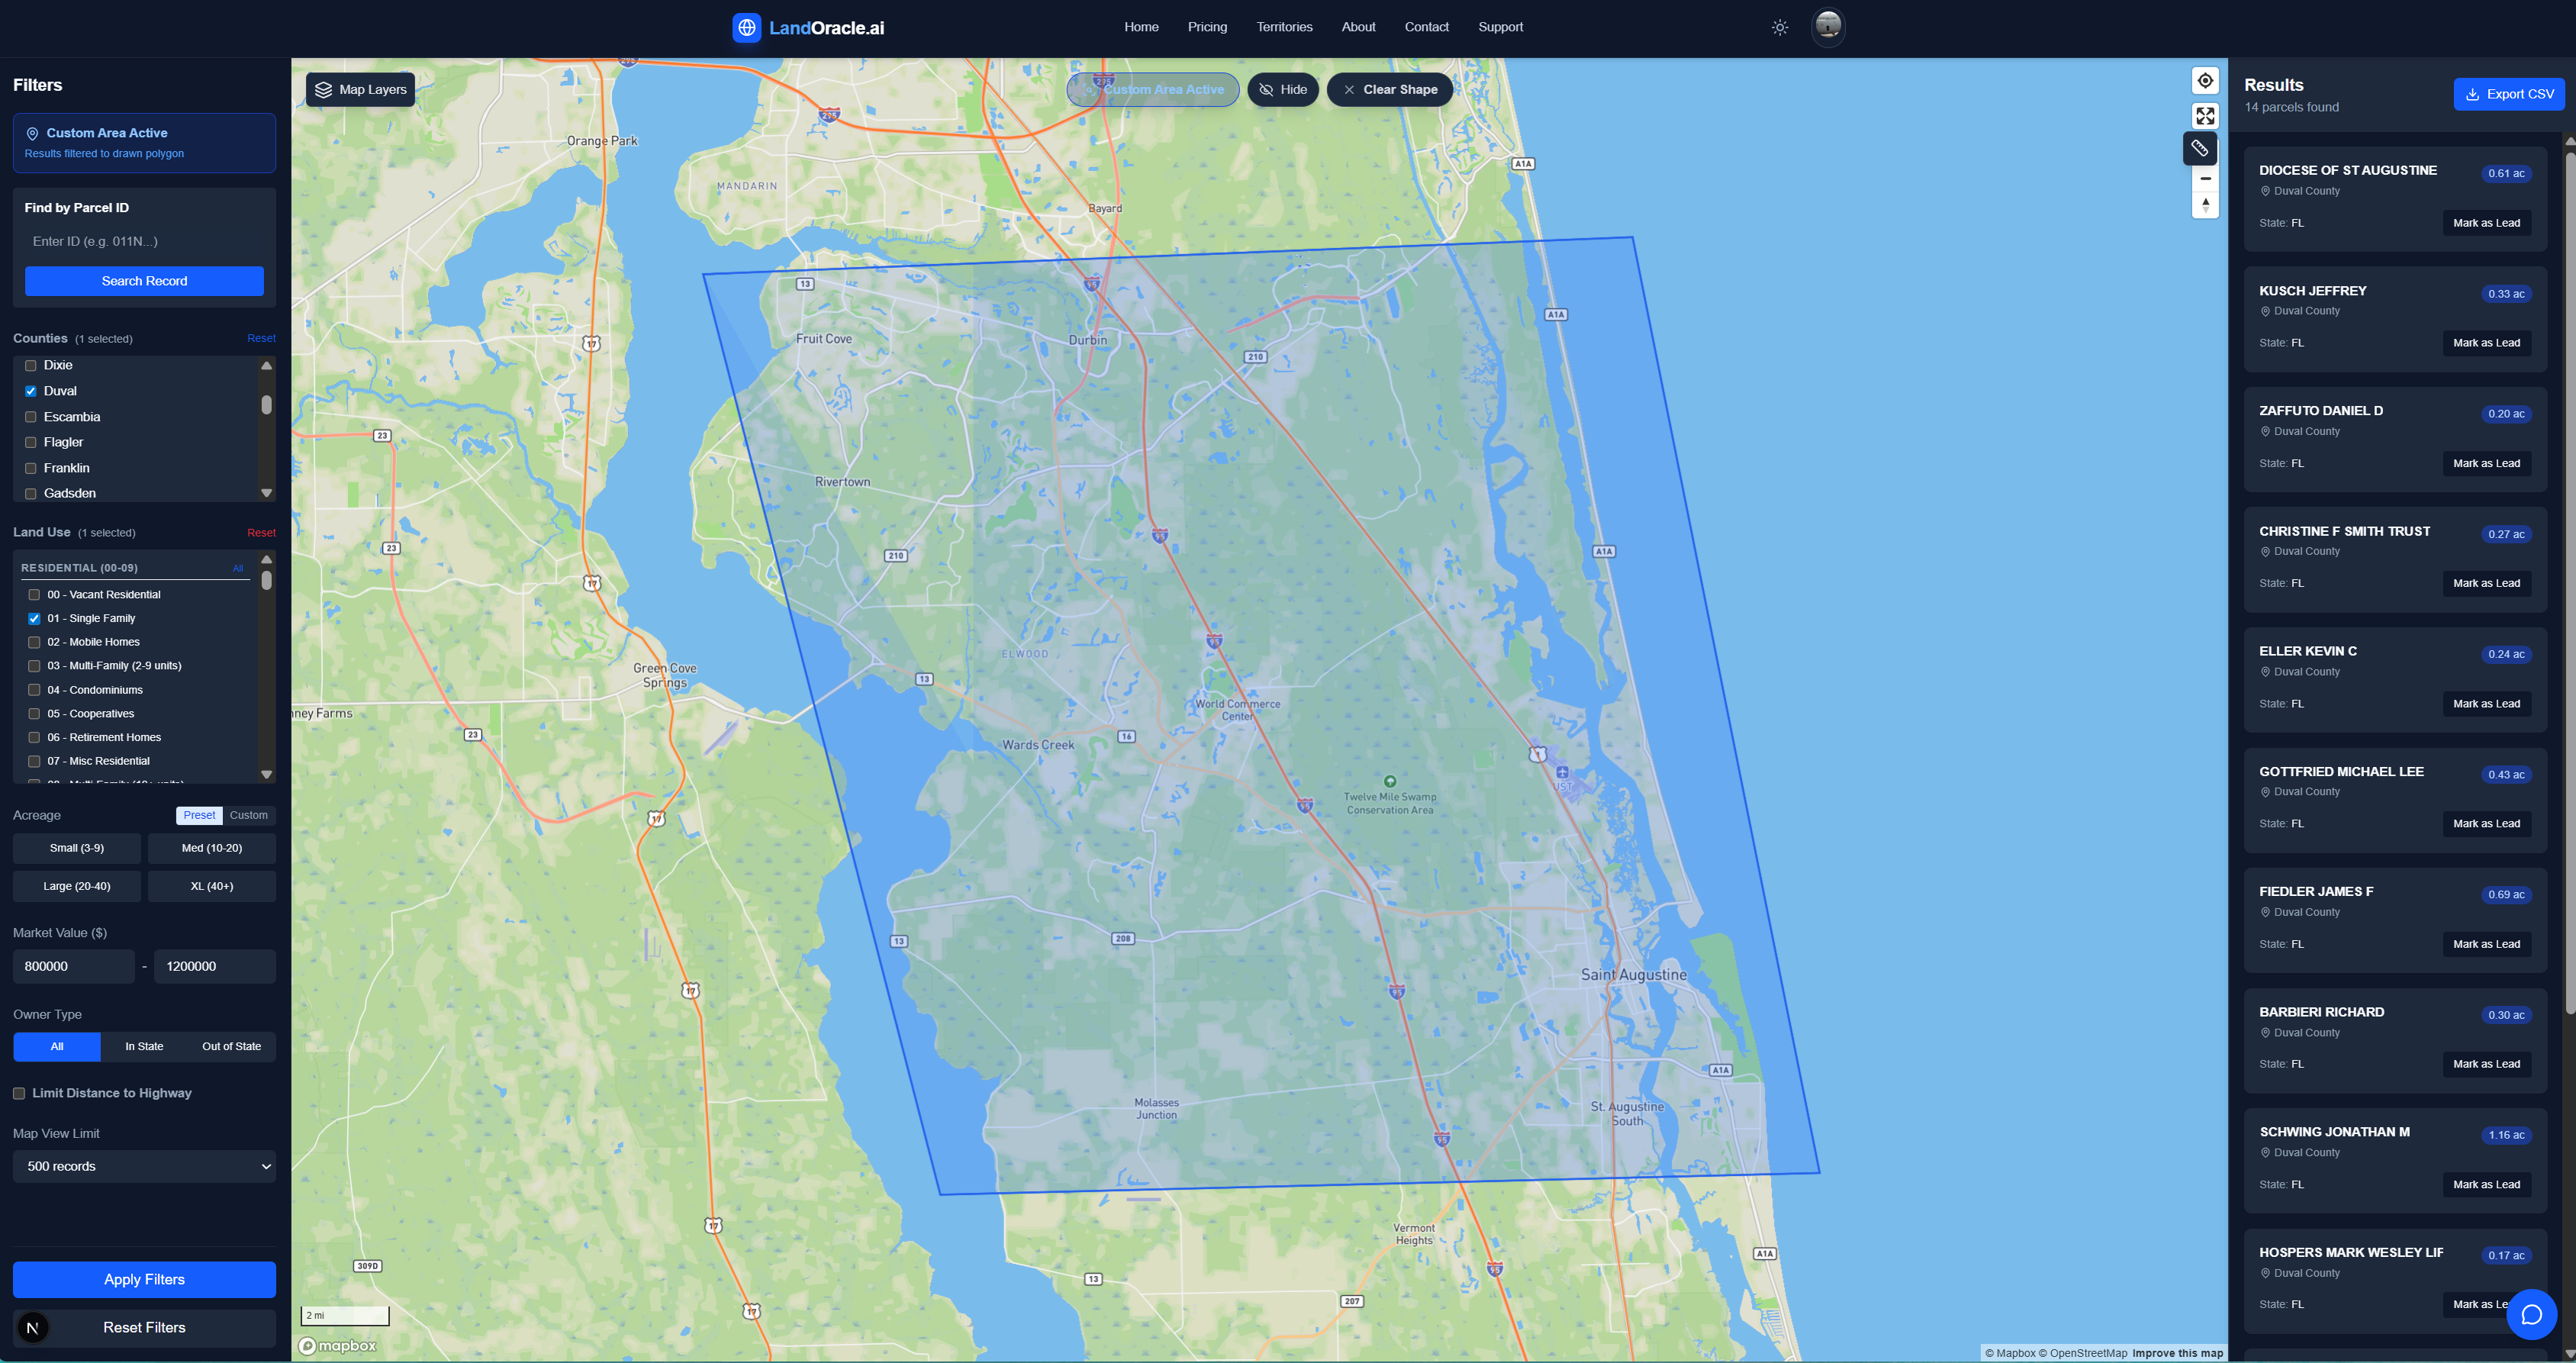
The Map (Opportunity Surface)
Shows parcels spatially. Colors guide attention. This is where you identify location context.
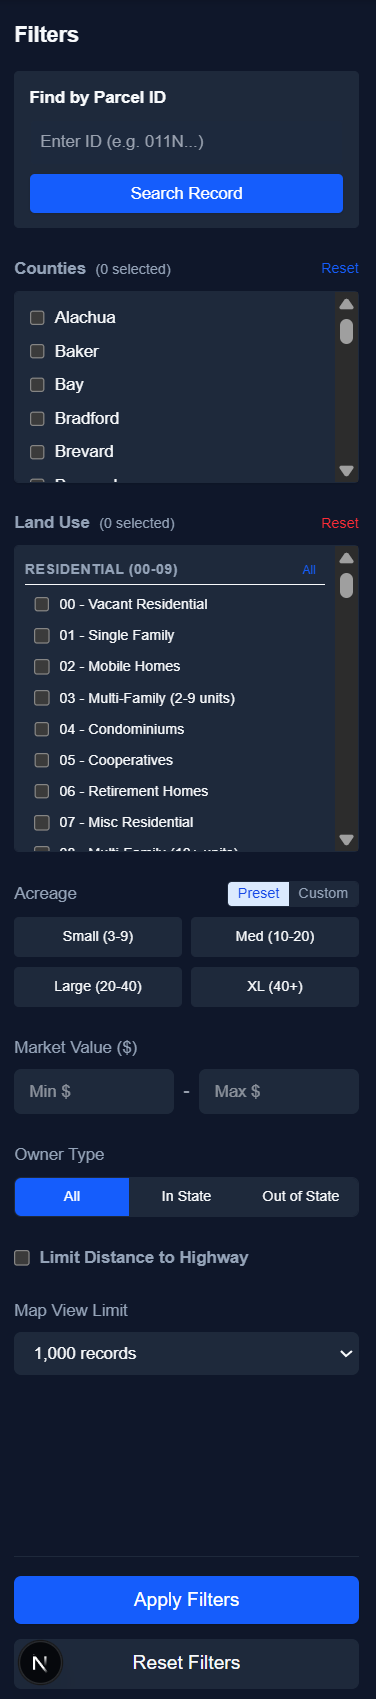
The Filter Panel
Located on the left. The Filters Panel removes parcels from view before evaluation, allowing you to focus only on land that fits your criteria.
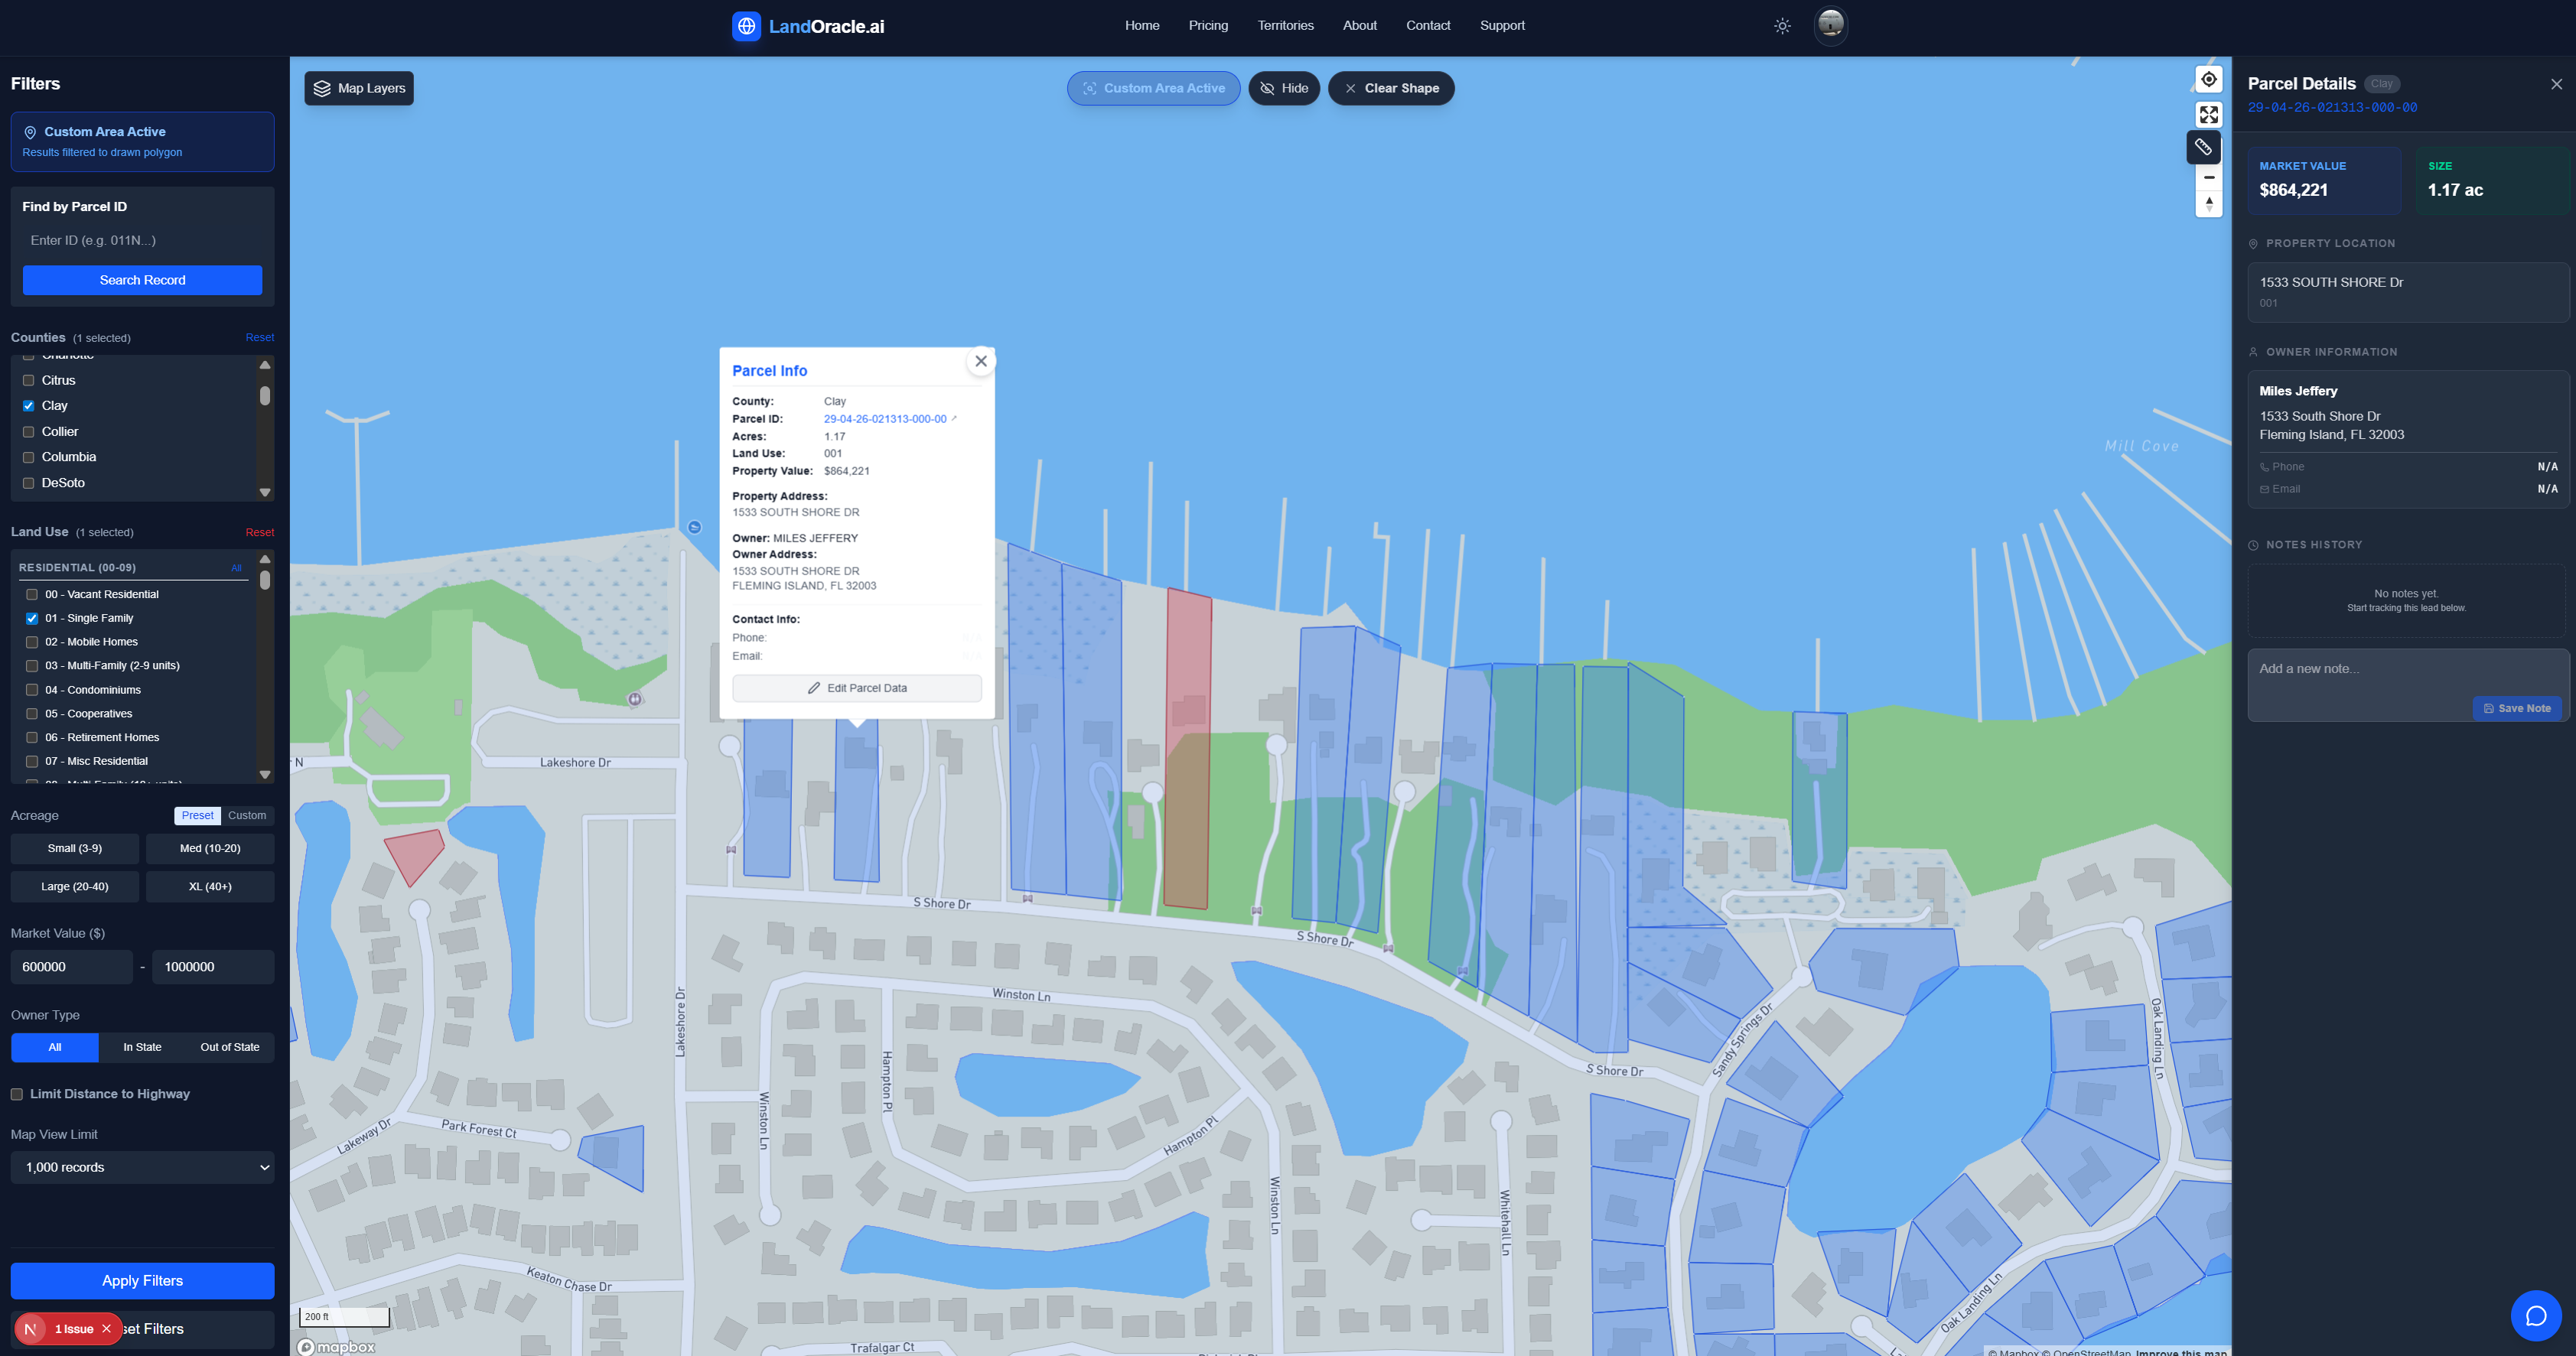
The Context Panel
Appears on the right when a parcel is clicked. Summarizes Owner, Land Use, Value, and AI Insights.
Shapes: Hide vs Clear
- Hides shape visually
- Keeps results visible
- Filtering remains active
- Removes shape entirely
- Resets results
- Clears filter
5. How AI Helps (and Where It Stops)
What AI Does: Summarizes dense rules, translates codes into plain language, and highlights overlapping constraints.
What AI Does Not Do: Decide feasibility, recommend purchases, or replace professionals.
Interpretation: AI summaries are contextual aids. They should trigger questions, not answer them definitively.
6. Using Filters & Shapes Effective
Filter Early Philosophy
The biggest mistake is trying to see everything. Use filters to narrow the field immediately.
High-Impact Filters
- Acreage: Define your Min/Max early.
- Land Use: Filter for "Residential" vs "Commercial" using the codes.
- Environmental: Exclude wetlands if your use case requires dry land.
Limit Distance from Highway
"Not all land is equally accessible, even when it appears close on a map."
The Limit Distance from Highway filter allows you to restrict results to parcels within a defined distance of major roadways. This is particularly useful when:
- Access matters for development, logistics, or construction
- Parcels without nearby highway access would be impractical
- You want to eliminate land that looks viable but is effectively hooked off from infrastructure
- • Measures distance to nearest qualifying highway
- • Removes parcels exceeding threshold
- • Surfaces realistically reachable land
- • Developers evaluating build feasibility
- • Solar/Energy teams assessing access
- • Agricultural buyers needing equipment access
Note: This filter evaluates proximity, not road quality. A passed parcel may still require easements or improvements. Use to eliminate obvious challenges, not to replace site investigation.
Avoid Over-Filtering
If no results appear, relax your constraints or reassess your assumptions. Start grid, then narrow down.
Filters vs Layers
Filters remove parcels from the map. Layers (like Zoning or Flood Zones) add visual information without hiding parcels.
7. Reports & Sharing
Reports capture early-stage understanding to share with partners or document analysis.
- When to Use: Sharing with stakeholders, documenting a find, or preparing for a site visit.
- What Included: Parcel overview, visual maps, constraint summaries, and AI highlights.
- Limitation: Reports do not replace surveys, title work, or physical inspections.
8. Common Use Cases
Land Investors
Screen many parcels quickly based on value spread and physical usability.
Developers
Assess feasibility (zoning, density, environmental) before capital spend.
Solar & Energy
Evaluate physical suitability (acreage, wetlands, transmission proximity) early.
Brokers & Advisors
Communicate land context clearly to clients with visual data.
9. Common Mistakes
- Treating the platform as advice (it's a tool).
- Skipping filters and getting overwhelmed by data.
- Visual overload (turn off layers you aren't using).
- Confusing "Land Use" (current status) with "Zoning" (legal potential).
- Expecting AI to know your specific investment strategy.
10. Reference & Glossary
Common Land Use Codes (FL)
Note: These are standard Dept of Revenue categories. Local variations may apply.
Key Definitions
- Constraint
- Any factor limiting land use (e.g. Wetlands, Zoning Setbacks).
- Opportunity Surface
- The map view, representing the field of potential deals before filtering.
- Layer
- Data visual overlays (e.g. Satellite, Flood Zones) that aren't clickable parcels but provide context.
- Context Panel
- The sidebar showing specific data for a selected parcel.